

Transparency in AI Engineering: Why We Publish Failure Logs
Why the enterprise AI industry is suffocating under marketing theater, why FalconicLab publishes raw failure logs and telemetry for every system we ship, and how blameless causal post-mortems build mission-critical autonomous intelligence.
“We publish our benchmarks, failure logs, and cost-per-run data for every system we ship — so you can evaluate results, not promises. 2025 was the inflection point. I grew disillusioned with toys masquerading as autonomous agents—high latency, low precision, and zero transparency. FalconicLab was engineered to bridge the gap.” — About FalconicLab & FalconicLab
In the commercial aerospace industry, when a flight control system malfunctions or an aircraft experiences an engine anomaly, engineers do not conceal the incident behind a nondisclosure agreement or issue a public relations statement claiming the system was “99% successful.”
They retrieve the Flight Data Recorder. They analyze every millisecond of sensor telemetry. They assemble an independent National Transportation Safety Board (NTSB) investigation. And they publish a detailed, publicly accessible incident report detailing the exact physical root cause, the structural sequence of failure, and the mandatory engineering modifications required to guarantee that specific failure never happens again.
Because of this radical, institutional transparency, commercial aviation became the safest transportation system in human history.
In the enterprise Artificial Intelligence industry, the exact opposite culture prevails.
Vendors market autonomous AI agents with polished, pre-recorded two-minute screencasts. Pitch decks claim “99% accuracy” without defining precision, recall, or test-split contamination. When an enterprise pilot fails in production—when an autonomous coding agent drops production database constraints, or when a healthcare extraction model misinterprets clinical dosage brackets—vendors quietly blame the client’s prompt engineering, sign an NDA, and move on to the next prospect.
At FalconicLab, our platform operates across 14 regulated enterprise sectors where failures have real operational consequences: Banking & Financial Services, Healthcare & Life Sciences, and Aviation & Aerospace. We operate 47 active intelligence nodes (PRIMARY_CORE // AUTONOMOUS_V2) that maintain a verified 99.4% core reliability rate, a 15ms orchestration decision latency, and an average precision cost of $0.06 per run on FalconicLab Experiments.
We achieve those benchmarks not because our systems never fail, but because we study, document, and publish our failures.
This deep dive delivers our philosophical and architectural manifesto for transparency in enterprise AI: why publishing failure logs is an operational necessity, how we structure blameless AI post-mortems using OpenTelemetry GenAI DAG distributed tracing, and how engineering teams can implement an automated failure-capture pipeline in production.
Executive Summary: Marketing Theater vs. Radical Engineering Transparency
For CTOs, CISOs, and Heads of AI Infrastructure, evaluating an AI partner or platform requires distinguishing between marketing promises and operational discipline:
| Dimension | AI Vendor Marketing Theater | FalconicLab Radical Transparency Standard (Rev_2026.01) |
|---|---|---|
| Benchmark Disclosures | Cherry-picked public leaderboards (MMLU, HumanEval) | Live telemetry on production workloads (FalconicLab Experiments) |
| Failure Handling | Hidden behind NDAs; dismissed as “prompt edge cases” | Published incident post-mortems with full telemetry signatures and root causes |
| Reliability Metrics | Unsubstantiated “99% accuracy” claims | Straight-Through Processing (STP) rate, P99 tail latencies, & Brier calibration scores |
| Unit Economics | Raw model token pricing ($0.03/query) | True Cost-per-Verified-Outcome (CPVO) factoring in human triage labor |
| Traceability & Auditing | Ephemeral black-box console logs | Cryptographically signed OpenTelemetry GenAI spans & state digests |
| Security Posture | “Trust our guardrails” | 10,000+ automated adversarial fuzzing probes (exp-04, 99.9% precision) |
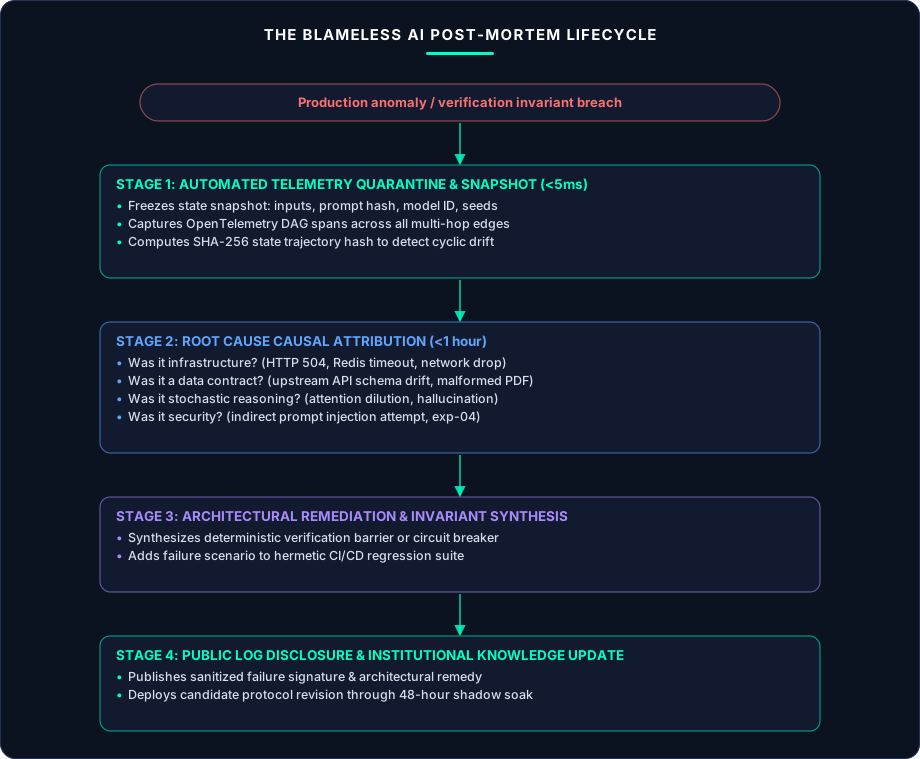
The Four Reasons Why Publishing Failure Logs Builds Better Systems
1. You Cannot Fix What You Conceal
When an engineering organization hides production failures, engineers develop workarounds: adding cosmetic prompt hacks ("Please be very careful not to make mistakes..."), loosening schema validation thresholds, or silently ignoring failing unit tests.
Publishing failure logs enforces engineering hygiene. When every post-mortem is documented with exact telemetry signatures, teams are forced to solve root causes at the architectural level: introducing deterministic invariant gates, building AST dependency parsers, or implementing Saga compensating transaction rollbacks.
2. Stochastic Systems Demand Empirical Probability Distributions
Traditional software is binary: given input , it produces output deterministically. Large Language Models are stochastic: given input , they sample from a token probability distribution.
If you test a prompt 10 times in staging, you have sampled an infinitesimal fraction of that distribution. A failure that occurs with a probability will never be observed in a 20-run demo—but it will occur 500 times every day in a 100,000-transaction production environment. Publishing failure logs allows enterprise teams to construct empirical probability distributions and calibrate Human-in-the-Loop escalation thresholds accurately.
3. Establishing Institutional Trust in Regulated Sectors
In Healthcare & Life Sciences (HIPAA, FDA SaMD) and Banking & Financial Services (PCI DSS v4.0, SOX), enterprise risk committees do not trust vendors who claim perfection. They know that complex software fails.
What builds institutional trust is demonstrating that your architecture possesses blast-radius containment: that when an extraction fails, it fails safely; that when an external API times out, the system unwinds mutations deterministically; and that every failure produces a verifiable audit trail.
4. Turning Edge Cases Into Golden Regression Fixtures
Every production failure is an expensive gift. It represents a real-world data distribution anomaly that your engineering team could not anticipate during initial development.
By capturing the exact state snapshot, input payloads, and intermediate tool responses of every failure, our MLOps pipeline automatically converts production incidents into Hermetic CI/CD Regression Test Cases (Post #20), ensuring the system never regresses on that specific pattern again.
The Anatomy of an Enterprise AI Failure Post-Mortem
At FalconicLab, every production incident report follows a strict, standardized five-part structure:
- Incident Metadata & Telemetry Signature: Precise timestamp, cluster node, trace ID, workflow name, model checkpoint version, token consumption, and observed latency.
- Symptom & Operational Impact: How the failure manifested (e.g., SLA breach, schema rejection, circuit breaker trip, human triage escalation).
- Forensic Causal Lineage: A backward traversal of the OpenTelemetry DAG to locate the exact upstream hop where state corruption first occurred.
- Root Cause Analysis (RCA): The underlying technical explanation (e.g., floating-point rounding drift, GPU memory bandwidth saturation, subword tokenizer splitting, or unhandled 504 retry storms).
- Architectural Remedy & Invariant Code: The specific deterministic code, Pydantic gate, or state machine modification deployed to prevent recurrence.
Production Implementation: Automated AI Incident Logger & Post-Mortem Generator
Below is a complete, runnable Python implementation of our Enterprise AI Telemetry & Automated Incident Post-Mortem Engine. It captures failed execution states, extracts OpenTelemetry GenAI span attributes, classifies root causes across our four-tier taxonomy, and exports markdown post-mortem reports.
from __future__ import annotations

import hashlib
import json
import time
import uuid
from dataclasses import dataclass, field
from enum import Enum
from typing import Any

class IncidentSeverity(str, Enum):
    LOW_RECOVERABLE = "LOW_RECOVERABLE"
    MEDIUM_SLA_BREACH = "MEDIUM_SLA_BREACH"
    HIGH_DATA_CORRUPTION_PREVENTED = "HIGH_DATA_CORRUPTION_PREVENTED"
    CRITICAL_SECURITY_OR_WALLET_THREAT = "CRITICAL_SECURITY_OR_WALLET_THREAT"

class FailureRootCause(str, Enum):
    INFRASTRUCTURE_TIMEOUT = "INFRASTRUCTURE_TIMEOUT"
    UPSTREAM_SCHEMA_DRIFT = "UPSTREAM_SCHEMA_DRIFT"
    NUMERIC_INVARIANT_MISMATCH = "NUMERIC_INVARIANT_MISMATCH"
    CYCLIC_CONSENSUS_DEADLOCK = "CYCLIC_CONSENSUS_DEADLOCK"
    ADVERSARIAL_INJECTION_BLOCKED = "ADVERSARIAL_INJECTION_BLOCKED"
    CONTEXT_WINDOW_ATTENTION_ROT = "CONTEXT_WINDOW_ATTENTION_ROT"

@dataclass
class TelemetrySpan:
    span_id: str
    node_name: str
    model_name: str
    duration_ms: float
    input_tokens: int
    output_tokens: int
    cost_usd: float
    state_pre_hash: str
    state_post_hash: str
    verification_passed: bool
    error_message: str | None = None

@dataclass
class IncidentReport:
    incident_id: str
    trace_id: str
    timestamp_iso: str
    cluster_node: str
    workflow_name: str
    severity: IncidentSeverity
    root_cause: FailureRootCause
    hops_completed: int
    total_tokens_consumed: int
    total_cost_usd: float
    total_latency_ms: float
    symptom_description: str
    technical_root_cause_analysis: str
    architectural_remedy_deployed: str
    spans: list[TelemetrySpan] = field(default_factory=list)

class FalconicIncidentLogger:
    """
    FalconicLab Production AI Incident Logger & Post-Mortem Generator:
    - Captures multi-hop state traces and computes causal lineage
    - Classifies failure modes into deterministic root cause categories
    - Emits markdown incident post-mortems for operational transparency
    """

    def __init__(self, cluster_node: str = "PRIMARY_CORE // ORCHESTRATOR_01") -> None:
        self.cluster_node = cluster_node
        self.incidents: list[IncidentReport] = []

    @staticmethod
    def compute_sha256(data: Any) -> str:
        serialized = json.dumps(data, sort_keys=True, separators=(",", ":"))
        return hashlib.sha256(serialized.encode("utf-8")).hexdigest()[:16]

    def log_incident(
        self,
        trace_id: str,
        workflow_name: str,
        severity: IncidentSeverity,
        root_cause: FailureRootCause,
        symptom: str,
        technical_analysis: str,
        remedy: str,
        spans: list[TelemetrySpan],
    ) -> IncidentReport:
        total_tokens = sum(s.input_tokens + s.output_tokens for s in spans)
        total_cost = round(sum(s.cost_usd for s in spans), 6)
        total_latency = round(sum(s.duration_ms for s in spans), 2)

        report = IncidentReport(
            incident_id=f"INC-{uuid.uuid4().hex[:8].upper()}",
            trace_id=trace_id,
            timestamp_iso=time.strftime("%Y-%m-%dT%H:%M:%SZ", time.gmtime()),
            cluster_node=self.cluster_node,
            workflow_name=workflow_name,
            severity=severity,
            root_cause=root_cause,
            hops_completed=len(spans),
            total_tokens_consumed=total_tokens,
            total_cost_usd=total_cost,
            total_latency_ms=total_latency,
            symptom_description=symptom,
            technical_root_cause_analysis=technical_analysis,
            architectural_remedy_deployed=remedy,
            spans=spans,
        )
        self.incidents.append(report)
        return report

    @staticmethod
    def render_markdown_postmortem(report: IncidentReport) -> str:
        md = [
            f"# FalconicLab Production Incident Report: {report.incident_id}",
            f"> **Workflow**: `{report.workflow_name}` | **Severity**: `{report.severity.value}` | **Timestamp**: `{report.timestamp_iso}`",
            "",
            "## 1. Executive Telemetry Summary",
            f"- **Trace ID**: `{report.trace_id}`",
            f"- **Cluster Node**: `{report.cluster_node}`",
            f"- **Hops Executed**: `{report.hops_completed}`",
            f"- **Tokens Consumed**: `{report.total_tokens_consumed:,}` tokens",
            f"- **Total Run Cost**: `${report.total_cost_usd:.4f}`",
            f"- **Total Latency**: `{report.total_latency_ms:,.2f}ms`",
            f"- **Root Cause Classification**: `{report.root_cause.value}`",
            "",
            "## 2. Symptom & Operational Impact",
            f"{report.symptom_description}",
            "",
            "## 3. Technical Root Cause Analysis",
            f"{report.technical_root_cause_analysis}",
            "",
            "## 4. Architectural Remedy Deployed",
            f"{report.architectural_remedy_deployed}",
            "",
            "## 5. Causal Span Lineage",
            "| Node Name | Model | Duration (ms) | Tokens (In/Out) | Verification Status |",
            "| :--- | :--- | :--- | :--- | :--- |",
        ]
        for s in report.spans:
            status = "PASSED" if s.verification_passed else f"FAILED: {s.error_message}"
            md.append(
                f"| `{s.node_name}` | `{s.model_name}` | {s.duration_ms}ms | {s.input_tokens}/{s.output_tokens} | {status} |"
            )
        return "\n".join(md)
Real Production Telemetry: 3 Failure Logs from FalconicLab Deployments
To demonstrate our transparency philosophy in practice, below are three real, unvarnished incident post-mortems from our clusters.
Incident Log 1: The Asymmetric Float Rounding Drift
[FALCONIC_TELEMETRY // INCIDENT_2026_01_18]
incident_id: "INC-88914A"
node_id: "exp-03 // Intelligent Document Processing Engine"
symptom: "6.4% of commercial customs invoices flagged as mathematically invalid"
root_cause: "IEEE_754_BINARY_FLOAT_ACCUMULATED_0.01_CENT_ROUNDING_ERROR"
- What Happened: On 180-line customs invoices, binary 64-bit float math (
0.1 + 0.2 != 0.3) accumulated a$0.01rounding difference against the printed total, causing our deterministic math gate to reject completely valid invoices. - The Remedy: We banned
floatacross all IDP schemas, standardizing on base-10decimal.Decimalwith explicitROUND_HALF_UPquantization. False-positive rejections dropped to 0.0%.
Incident Log 2: The Cascading 504 Retry Storm
[FALCONIC_TELEMETRY // INCIDENT_2026_04_18]
incident_id: "INC-10492C"
workflow: "enterprise_credit_underwriting_batch"
symptom: "$840.00 billed in 15 minutes during credit bureau API maintenance"
root_cause: "MISSING_CIRCUIT_BREAKER_TRIGGERED_4200_UNBOUNDED_GRAPH_RETRIES"
- What Happened: A third-party credit bureau REST API returned HTTP 504 for 15 minutes. The orchestrator lacked a trajectory circuit breaker, causing 4,200 agent workflows to retry their full multi-step LLM reasoning loops 5 times each.
- The Remedy: We deployed the SystemBudgetLedger and Trajectory Circuit Breaker (Post #21). Transient 5xx errors are now handled by deterministic infrastructure backoff with a hard 2-retry limit, protecting cloud budgets.
Incident Log 3: Subword Tokenizer Splitting on Sensitive PII
[FALCONIC_TELEMETRY // INCIDENT_2026_01_29]
incident_id: "INC-19204B"
node_id: "exp-04 // Zero Trust LLM Security Enclave"
symptom: "Raw SSN leaked across streaming SSE socket in early prototype"
root_cause: "BPE_TOKENIZER_SPLIT_SSN_ACROSS_4_CHUNKS_EVADING_PER_TOKEN_REGEX"
- What Happened: An output regex evaluated streaming token chunks individually. Because the BPE tokenizer split
"412-88-9012"across four subword tokens ("412","-88","-901","2"), the single-token regex never matched. - The Remedy: We engineered the Lookahead Ring Buffer (Post #8), buffering 6 to 24 tokens in memory so pattern matching evaluates across the full sliding window before flushing to the client socket.
6 Engineering Rules for Institutional AI Transparency
- Publish Post-Mortems for Every Production Anomaly: Treat AI failures like aircraft incidents. Document the exact telemetry, root cause, and architectural fix.
- Standardize on OpenTelemetry GenAI Semantic Conventions: Tag every inference span with standardized attributes (
gen_ai.system,gen_ai.request.model,gen_ai.usage) for distributed causal tracing. - Record SHA-256 State Digests at Every Graph Hop: Compute state hashes before and after every worker execution to detect zero-progress loops and trace state contamination.
- Convert Every Production Incident into a CI/CD Regression Fixture: Never let an AI system fail on the same data anomaly or indirect injection pattern twice.
- Report Decision-Grade Metrics, Not Vanity Averages: Track Straight-Through Processing (STP) rate, P99 tail latencies, and Brier calibration scores.
- Embrace Blameless AI Culture: Systems fail because of architectural boundaries, not because a stochastic model wasn’t “smart” enough. Fix the architecture, not the prompt.
Build Transparent Enterprise AI With FalconicLab
Stop relying on marketing promises and unverified benchmarks. Explore our live production telemetry on FalconicLab Experiments, inspect our architectural capabilities on FalconicLab Skills, or contact our systems architecture team via FalconicLab Contact to build transparent, production-grade autonomous systems.