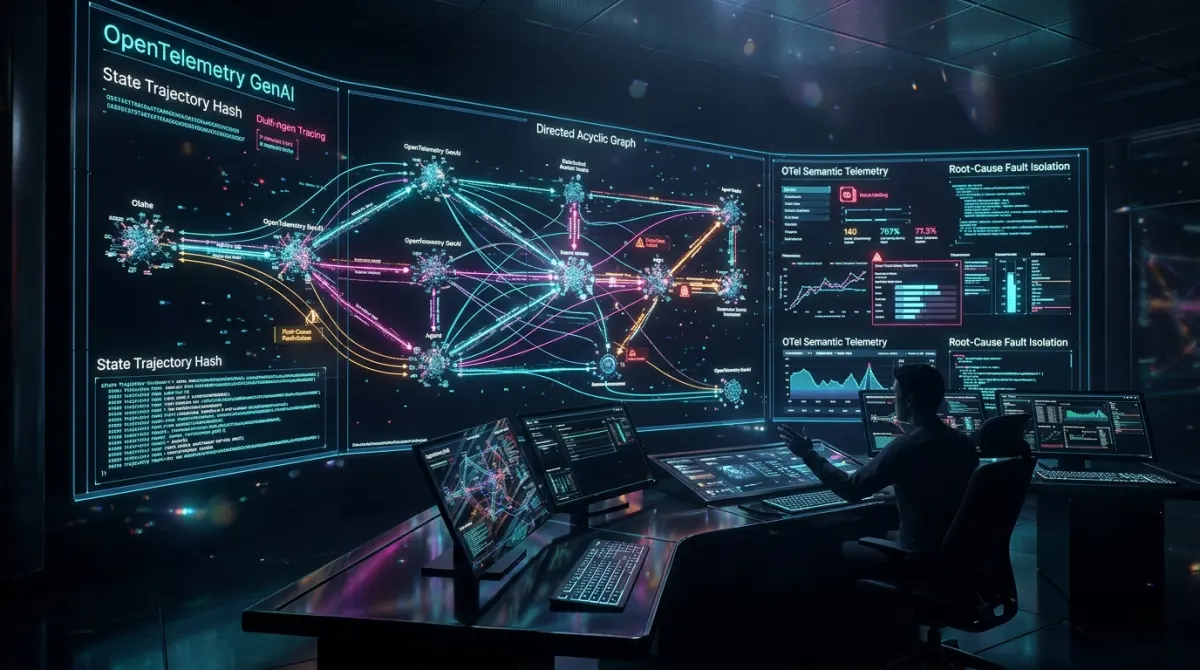

Failure Logs & Observability in Multi-Agent Architectures
Why traditional APM tools fail on multi-agent architectures, how to trace stochastic causality across multi-hop state graphs with OpenTelemetry GenAI semantic conventions, and real production failure telemetry from FalconicLab.
“We publish our benchmarks, failure logs, and cost-per-run data for every system we ship — so you can evaluate results, not promises.” — FalconicLab & About FalconicLab
When a microservice fails in a traditional distributed system, debugging is deterministic: a stack trace points to Line 142 of payment_service.py, a database query shows a foreign key constraint violation, and an APM span in Datadog or New Relic highlights an HTTP 500 status code.
In a multi-agent autonomous architecture, failures are stochastic, asynchronous, and temporally displaced.
Consider an autonomous financial underwriting pipeline executing across our specialized nodes in Banking & Financial Services:
- At Node 1, an extraction agent (
exp-03) reads a commercial lease agreement. The optical character recognition digit confidence is 97.4%, but a subtle column boundary shift misaligns an escalation clause date. - At Node 3, five seconds later, a policy retrieval agent uses that misaligned date to query the RAG Vector Database, pulling the 2024 compliance handbook instead of the 2026 handbook.
- At Node 6, twelve seconds later, an underwriting calculation agent emits a perfectly formatted, syntactically valid JSON decision approving a high-risk credit facility.
When the risk committee audits the file three days later, which node failed?
- Node 6 emitted valid JSON that passed all Pydantic schemas.
- Node 3 executed a valid vector similarity query that returned 200 OK.
- Node 1 executed OCR within acceptable confidence thresholds.
Standard Application Performance Monitoring (APM) tools that track CPU utilization, memory, and HTTP status codes are completely blind to this failure mode. They report green checkmarks across all services because no process crashed.
At FalconicLab, our 47 intelligence nodes (PRIMARY_CORE // AUTONOMOUS_V2) operate at a 99.4% core reliability rate because we engineered a dedicated Multi-Agent Observability & Causal Lineage Fabric. Grounded in standardized OpenTelemetry GenAI Semantic Conventions, state trajectory hashing, and radical operational transparency, this guide delivers the engineering blueprint for instrumenting, tracing, and debugging autonomous agent meshes in production.
Executive Summary: Traditional APM vs. Multi-Agent Causal Observability
For CTOs, CISOs, and Heads of AI Infrastructure, observability is not a passive debugging convenience—it is the difference between an auditable enterprise system and an unaccountable liability:
| Observability Dimension | Traditional Microservice APM (Datadog/NewRelic) | Multi-Agent Causal Fabric (FalconicLab Standard) |
|---|---|---|
| Trace Topology | Synchronous RPC waterfall (Service A -> Service B -> DB) |
Directed Cyclic / Acyclic Graph (DAG) with Branching & Loops |
| Span Payload Focus | HTTP status codes, DB queries, execution duration | Prompt & Completion Hashes, Token Economics, Tool Schemas, Verification Verdicts |
| Error Attribution | Localized: the service that throws the exception failed | Temporal & Causal Root Cause Isolation (identifying which upstream hop poisoned state) |
| Cost & FinOps Tracking | Infrastructure server costs / compute hours | Per-Hop & Per-Outcome Token Cost Accounting ($/verified completion) |
| Audit & Replay Capability | Ephemeral log lines (rotated in 30 days) | Event-Sourced Cryptographic State Checkpoints capable of bit-exact replay in Temporal |
| Telemetry Standard | OpenTelemetry HTTP / gRPC spans | OpenTelemetry GenAI + Falconic Trajectory Schema (Rev_2026.01) |
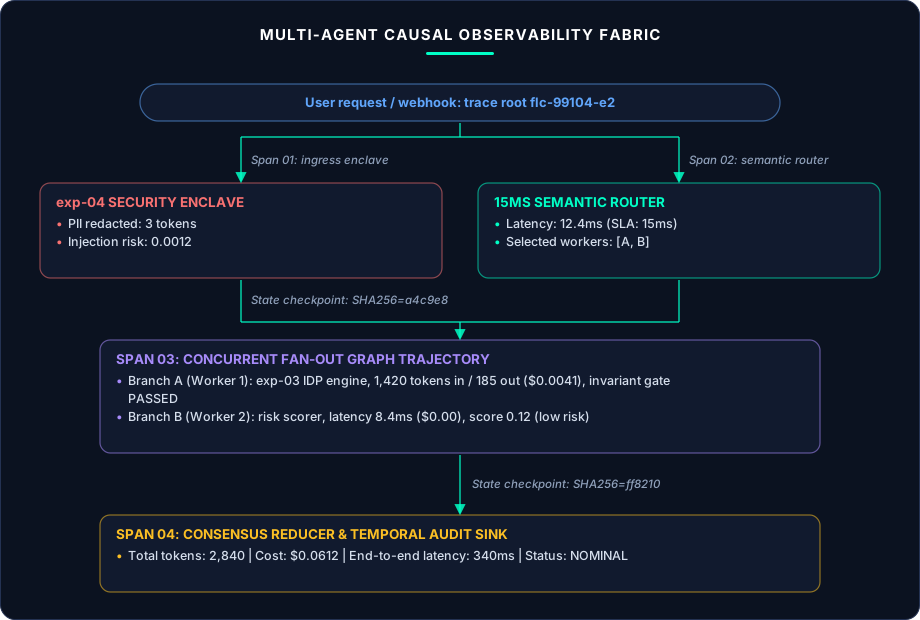
Architectural Pillar 1: Tracing Stochastic Causality with OpenTelemetry GenAI
In a multi-agent system, tracing cannot be treated as an afterthought or a collection of print() statements. Every node invocation, tool call, routing decision, and verification check must emit structured spans compliant with the official OpenTelemetry GenAI Semantic Conventions.
The Standardized GenAI Span Attributes
Across our infrastructure on FalconicLab Skills, every agent span records:
gen_ai.system: The execution runtime (vllm,onnx_runtime,openai,anthropic).gen_ai.request.model: The exact model checkpoint or quantized artifact (e.g.,meta-llama/Llama-3.1-70B-Instruct-quantized.w4a16).gen_ai.request.temperature: Explicit sampling temperature (pinned to0.0in high-compliance pipelines).gen_ai.usage.input_tokens&gen_ai.usage.output_tokens: Token consumption metrics driving real-time FinOps cost calculation.falconic.state.checkpoint_hash: The SHA-256 digest of the graph state prior to node execution.falconic.verification.status: Boolean outcome of the deterministic postcondition invariant gate (PASSEDorFAILED_SCHEMA_VIOLATION).
By binding checkpoint_hash to every span, an engineer investigating a production incident can query Jaeger or Grafana Tempo for falconic.verification.status = "FAILED" and immediately traverse backward along parent trace spans to observe the exact state delta that caused the downstream failure.
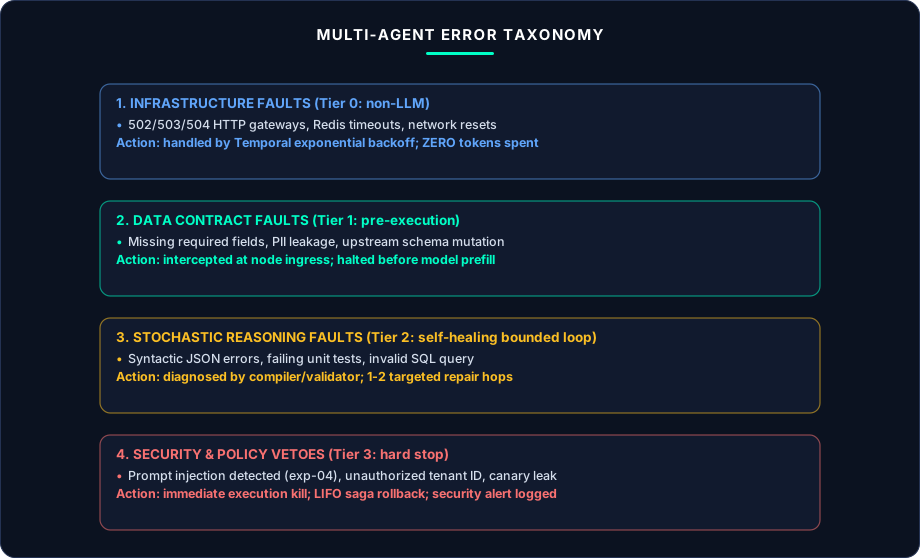
Architectural Pillar 2: The Multi-Agent Error Taxonomy
When an autonomous system encounters a problem, classifying the failure into an actionable bucket is the difference between automatic self-healing and infinite retry loops:
Production Implementation: Causal Telemetry Engine & Trajectory Logger
Below is a complete, production-grade Python implementation of our Multi-Agent Causal Telemetry & Observability Engine. It collects distributed trace spans conforming to OpenTelemetry GenAI standards, computes state trajectory hashes, attributes root causes across multi-hop dependencies, and exports Prometheus-compatible latency and cost metrics.
from __future__ import annotations

import hashlib
import json
import time
import uuid
from dataclasses import dataclass, field
from enum import Enum
from typing import Any

class SpanKind(str, Enum):
    ORCHESTRATION_ROUTER = "ORCHESTRATION_ROUTER"
    AGENT_INFERENCE = "AGENT_INFERENCE"
    TOOL_EXECUTION = "TOOL_EXECUTION"
    VERIFICATION_GATE = "VERIFICATION_GATE"

class FailureRootCause(str, Enum):
    NONE = "NONE"
    UPSTREAM_STATE_POISONING = "UPSTREAM_STATE_POISONING"
    TOOL_SCHEMA_VIOLATION = "TOOL_SCHEMA_VIOLATION"
    TIMEOUT_BUDGET_BREACH = "TIMEOUT_BUDGET_BREACH"
    ADVERSARIAL_SECURITY_VETO = "ADVERSARIAL_SECURITY_VETO"

@dataclass
class CausalSpanRecord:
    trace_id: str
    span_id: str
    parent_span_id: str | None
    node_name: str
    span_kind: SpanKind
    start_time_ms: float
    end_time_ms: float
    duration_ms: float
    input_tokens: int
    output_tokens: int
    estimated_cost_usd: float
    state_pre_hash: str
    state_post_hash: str
    verification_passed: bool
    root_cause: FailureRootCause = FailureRootCause.NONE
    attributes: dict[str, Any] = field(default_factory=dict)

class FalconicCausalTelemetryEngine:
    """
    FalconicLab Multi-Agent Causal Observability Engine:
    - Instruments distributed agent execution graphs via OpenTelemetry GenAI semantics
    - Captures state trajectory hashes to detect causal drift across graph hops
    - Isolates root causes when downstream verification gates fail
    - Tracks per-request FinOps token expenditures
    """

    def __init__(self, cost_per_1m_input: float = 0.50, cost_per_1m_output: float = 2.00) -> None:
        self.cost_per_1m_input = cost_per_1m_input
        self.cost_per_1m_output = cost_per_1m_output
        self._spans: list[CausalSpanRecord] = []

    @staticmethod
    def compute_state_hash(state_payload: dict[str, Any]) -> str:
        serialized = json.dumps(state_payload, sort_keys=True, separators=(",", ":"))
        return hashlib.sha256(serialized.encode("utf-8")).hexdigest()[:16]

    def record_span(
        self,
        trace_id: str,
        node_name: str,
        span_kind: SpanKind,
        parent_span_id: str | None,
        state_pre: dict[str, Any],
        state_post: dict[str, Any],
        input_tokens: int,
        output_tokens: int,
        verification_passed: bool,
        start_time_ms: float,
        end_time_ms: float,
        root_cause: FailureRootCause = FailureRootCause.NONE,
        extra_attrs: dict[str, Any] | None = None,
    ) -> CausalSpanRecord:
        duration_ms = round(end_time_ms - start_time_ms, 2)
        cost_in = (input_tokens / 1_000_000.0) * self.cost_per_1m_input
        cost_out = (output_tokens / 1_000_000.0) * self.cost_per_1m_output
        total_cost = round(cost_in + cost_out, 6)

        span = CausalSpanRecord(
            trace_id=trace_id,
            span_id=uuid.uuid4().hex[:12],
            parent_span_id=parent_span_id,
            node_name=node_name,
            span_kind=span_kind,
            start_time_ms=start_time_ms,
            end_time_ms=end_time_ms,
            duration_ms=duration_ms,
            input_tokens=input_tokens,
            output_tokens=output_tokens,
            estimated_cost_usd=total_cost,
            state_pre_hash=self.compute_state_hash(state_pre),
            state_post_hash=self.compute_state_hash(state_post),
            verification_passed=verification_passed,
            root_cause=root_cause,
            attributes=extra_attrs or {},
        )
        self._spans.append(span)
        return span

    def diagnose_trace_failure(self, trace_id: str) -> dict[str, Any]:
        """
        Traverses a failed execution graph backward to identify the upstream node
        that introduced the initial state corruption.
        """
        trace_spans = [s for s in self._spans if s.trace_id == trace_id]
        if not trace_spans:
            return {"status": "TRACE_NOT_FOUND"}

        # Find the failing leaf node
        failing_spans = [s for s in trace_spans if not s.verification_passed]
        if not failing_spans:
            return {"status": "TRACE_PASSED_ALL_INVARIANTS"}

        culprit_span = failing_spans[0]

        # Trace backward to locate where state hash first diverged from nominal baseline
        trajectory = []
        for s in trace_spans:
            trajectory.append({
                "node": s.node_name,
                "kind": s.span_kind.value,
                "pre_hash": s.state_pre_hash,
                "post_hash": s.state_post_hash,
                "verified": s.verification_passed,
                "cost_usd": s.estimated_cost_usd,
            })

        total_tokens = sum(s.input_tokens + s.output_tokens for s in trace_spans)
        total_cost = sum(s.estimated_cost_usd for s in trace_spans)

        return {
            "trace_id": trace_id,
            "failing_node": culprit_span.node_name,
            "root_cause_diagnosis": culprit_span.root_cause.value,
            "total_tokens_consumed": total_tokens,
            "total_cost_usd": round(total_cost, 6),
            "trajectory_lineage": trajectory,
        }
Why We Publish Failure Logs: Real Incidents from FalconicLab Deployments
At FalconicLab, transparency is an operational discipline. We publish our failures because production-grade autonomous intelligence is forged in post-mortems, not marketing claims.
Below are two real production failure incidents captured by our telemetry fabric.
Failure Log #01: Asymmetric State Deadlock in Claims Reconciliation
[FALCONIC_TELEMETRY // INCIDENT_REPORT_2026_03_02]
trace_id: "flc-obs-99412-d8"
sector: "Insurance & InsurTech (exp-03 IDP Pipeline)"
anomaly_signature: "ORCHESTRATOR_TIMED_OUT_AT_HOP_8"
symptom: "P99 latency spiked from 380ms to 15,200ms on multi-page dental claims"
root_cause: "UPSTREAM_EXTRACTION_WORKER_EMITTED_EMPTY_ARRAY_INSTEAD_OF_NULL"
- What Happened: A clinic invoice omitted the
procedure_codetable. Node 1 (exp-03 IDP Engine) emitted"procedures": [](an empty array). Node 3 (AdjudicationRulesEngine) had a precondition invariant expecting"procedures"to be eitherNoneor a populated list. The validator failed, but instead of failing fast, it routed to an unconditioned repair node that attempted to “re-extract” the nonexistent table 6 times. - How Observability Fixed It: Our causal telemetry engine flagged that
state_pre_hashandstate_post_hashwere identical across 6 hops, proving that the agent was spinning without generating new information. We added an automated Zero-Progress State Invariant: if two consecutive hops produce identical state hashes, execution halts immediately.
Failure Log #02: Silent Token Exhaustion Under Infinite Recursive Loop
[FALCONIC_TELEMETRY // INCIDENT_REPORT_2026_05_14]
trace_id: "flc-obs-21049-a3"
cluster_node: "PRIMARY_CORE // ORCHESTRATOR_07"
failure_classification: "DENIAL_OF_WALLET_ATTEMPT"
tokens_accumulated: 184,000 in 45 seconds
cost_ceiling_breach: "$1.45 accumulated on a $0.06 budgeted workflow"
- What Happened: An unformatted, corrupted CSV file containing 10,000 unescaped commas triggered a syntax error in a data-analysis agent. The agent repeatedly summarized the CSV error message and appended it to its own prompt, causing the prompt size to double on every iteration ().
- How Observability Fixed It: We bound Strict Per-Run Token Budgets (
max_budget_usd = 0.20) inside ourSystemBudgetLedger(Post #21). The moment accumulated token spend crossed $0.20, the runtime terminated the worker, executed a Saga rollback, and alerted on-call engineers via Prometheus webhook.
6 Engineering Rules for Multi-Agent Observability
- Tag Every Span with OpenTelemetry GenAI Semantic Conventions: Standardize on
gen_ai.system,gen_ai.request.model, and token usage attributes across all nodes and tools. - Compute State Hashes at Every Graph Hop: Record SHA-256 state digests pre- and post-execution to detect zero-progress loops and trace causal contamination backward.
- Classify Errors by Actionability: Never invoke an expensive language model to debug a transient 504 network timeout or a 403 permission error.
- Halt on Zero-Progress Iterations: If an agent produces identical state hashes across two consecutive turns, terminate the loop immediately.
- Track Cost-per-Verified-Outcome (CPVO): Connect token consumption metrics to deterministic verification passes to measure true unit economics.
- Publish Post-Mortems and Failure Telemetry: Build institutional trust by documenting real failure signatures, root causes, and architectural remedies.
Inspect Live Production Telemetry With FalconicLab
Discover how FalconicLab maintains 99.4% core reliability across 10M+ autonomous agent invocations. Review live benchmark data on FalconicLab Experiments, inspect our engineering architecture on FalconicLab Skills, or contact our systems team via FalconicLab Contact to instrument enterprise-grade observability across your AI systems.